
Buckets OSS
Buckets answers one question: for every database read your app makes, where did it go? It attributes every read to the feature that served it, shows you the effect of a change before and after you ship it, and — connect Slack — pages you the moment a real read spike begins, before the invoice is in the post. The collector is open source; this page is how you read it inside Crossdeck and how the cost alerts work.
TL;DR
- Every read is caught and attributed. Buckets is the meter — it counts reads at the source, so its number is authoritative. Reads it can't attribute to a feature surface honestly as
unknown. - It's a before/after instrument, not wallpaper. Mark the change you shipped and watch each bucket's reads go from before to now. Raw operation counts only — verify the saving on your provider's bill (the source of truth for money).
- Name an
unknownbucket with one line:bucket("nightly-export", fn). Drill and tag until the source is named. - Get paged in Slack on a real spike — after a ~7-day baseline, only on a genuine deviation, once per episode, with a one-click "expected, quiet for 24h."
- It never costs you reads. Every part reads a small maintained summary — nothing scans.
- Read it back locally, no account needed. The collector writes a live readout to
.crossdeck/buckets.md— open it or ask your AI session to "read me my buckets." Sign up and the same numbers surface here, with the drill-down, before/after, and spike alerts. - Not just Firestore — MongoDB and Postgres too.
installMongoMeter(...)counts the documents your reads return;installPgMeter({ Client })counts the rows your queries return — one adapter covering Supabase, Neon, Vercel Postgres, RDS and plain Postgres. Both attribute to the samebucket()paths. Each database is measured in its own raw unit — Firestore in reads, MongoDB in docs read, Postgres in rows read — never a dollar bill; the dashboard renders whichever language your project speaks.
Where your reads go
Find Buckets under Errors → Buckets OSS. The main view ranks your buckets by reads, so the heaviest surface is the longest bar. A bucket is either tagged — attributed to a named feature you wrapped — or untagged, flagged with a tap-to-name pill, meaning Buckets caught the read and labelled it by collection (col:events) but no feature name has been set on that path yet. Untagged is never a blind spot; it's a to-do with a one-line fix (see Name a bucket).
Each bar is colour-coded by the environment the read ran in — your server, your users' browser, or the dashboard itself. One solid colour means a bucket reads from a single place; split colours mean it bleeds from more than one, and hovering a segment names the count and environment. So a heavy bucket doesn't just tell you which query — it tells you where to go fix it, a backend scan or a client listener, at every drill-down level.
Before and after a change
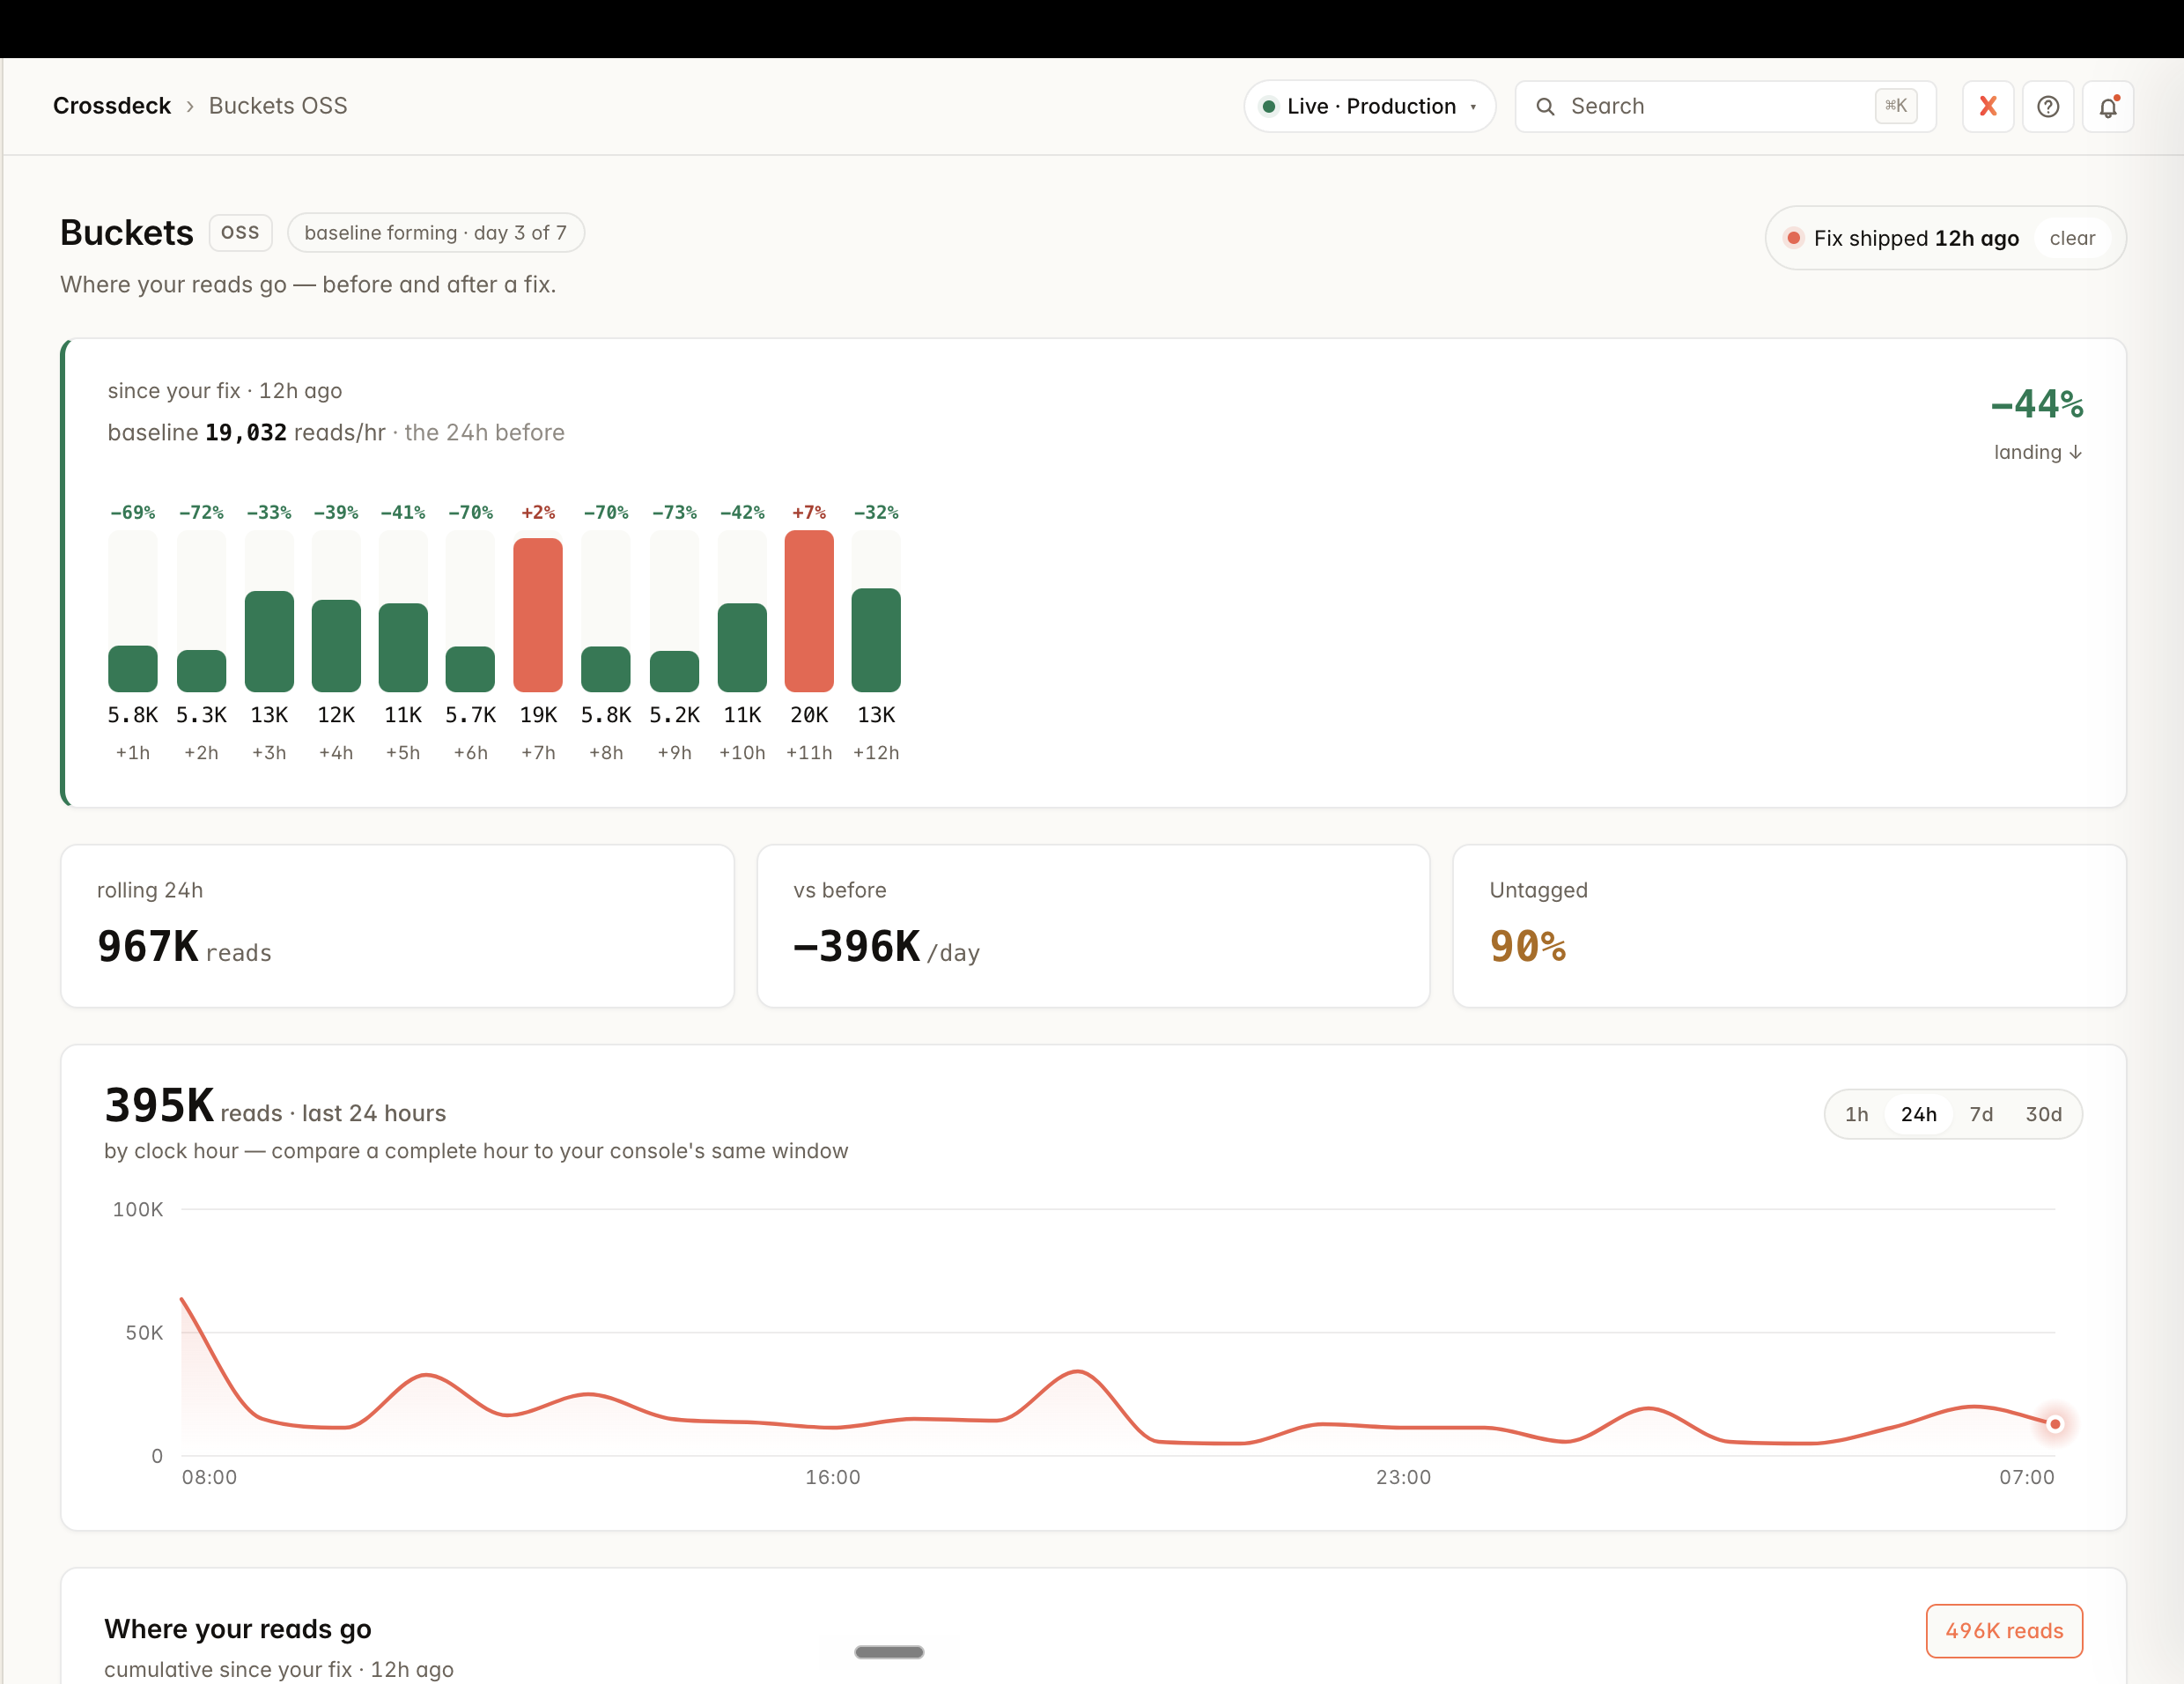
The point of Buckets isn't to admire a number — it's to answer "I made a change, did it work?" Set the change-date marker to the day you shipped, and every bucket shows its reads before the change (a faint track) and now (the solid fill). A surface you fixed visibly shrinks; one you didn't sits unchanged. The headline tells you the whole story at a glance:
// the headline after shipping a maintained-read fix
2,358,918 → 1,632,118 reads/day   // −31%  ·  −726,800 reads/day
Switch the trend to hourly to watch a fix land this hour — you don't have to wait for tomorrow's number, or spend another day's reads to find out it worked.
Name a bucket
This works exactly like custom events: auto-capture is free, and you name the things that matter. When a bucket shows as unknown, wrap that read path in bucket() and every read inside it is attributed to that name:
import { bucket } from "@cross-deck/buckets";

// every read inside here is attributed to "nightly-export"
await bucket("nightly-export", async () => {
  const rows = await db.collection("events").where(/* … */).get();
});
Two grains: tag a whole surface — bucket("pulse-map", handler) — or tag a single query — bucket("owner-lookup", () => db.doc(id).get()). Drill in, ship, look again, and keep going until the read is named down to the line you care about.
Name a whole operation at its boundary — not query-by-query. Wrap your route or resolver once and every read inside inherits the name; an inner bucket() still wins, so you refine only the hot paths. Where the operation name is already on hand — a gateway or router — it's a single line that names your entire API. A tRPC base procedure as bucket(path, () => next()) turns every read into issues.list / revenue.portfolio; an Express route as bucket("users.show", () => handler(req, res)) names it by the route, not the raw URL. One change, your whole API named by operation — this is exactly how Crossdeck names every read in its own dashboard.
Tagging applies going forward, not backward. A count is a fact at the moment it happens — Buckets never rewrites history. So after you ship a tag, the old unknown / col:* bucket won't rename itself; a new named bucket appears and grows as fresh reads land, while the unnamed one stops climbing. The next full day shows the path named from its first hour. Watch for the new name appearing — not the old bar changing colour.
Tagged it, but it's still showing untagged? You tagged the wrong path. The check after you ship is simple: did your new name start growing while the col:* bucket stopped climbing? If instead the untagged bucket keeps climbing and your name never grows, the reads aren't flowing through the code you wrapped. The collection tells you what is read, not where — and the same collection is usually read from several places. Re-evaluate which path actually issues the reads and tag that one. A tell: a smooth, constant rhythm — especially with nobody using the app — is a machine (a scheduled job or per-event processing), not a person; a spiky, daytime pattern is user-driven. Let the shape point you at the right path.
Not sure what to tag? Ask your database. Your datastore already ranks its own most expensive reads. On Firestore, open the Firebase console → Firestore → Query Insights: it lists your top queries by read volume, the collection each one hits, and how many documents each scan touches — a tagging to-do list, sorted by cost. Find the heaviest query, find the code path that issues it, and wrap that in a bucket() — your most expensive read, named first. (MongoDB: Atlas Performance Advisor. Postgres: pg_stat_statements.)
Who caused it — reads by user × function
A bucket tells you which query is heavy and where it runs. The cross-match tells you the last thing you're missing: which user the reads were spent on. Tell Buckets who's behind a request — one line, the id you already have at your auth boundary — and every read from that point attributes to the person and the operation that spent it.
import { setActor } from "@cross-deck/buckets";

// at your request boundary — the user id you already have
setActor(req.user.id);
That's the whole change. With Crossdeck's hosted SDK wired, setActor is called for you on identify() — but the line above is all the OSS collector needs, on its own, no account. Run the readout and the two axes appear:
$ npx @cross-deck/buckets

# Who caused the reads
  tory@biotree.bio      48,210
  machine               12,940
  anonymous              3,002

# Who × what — which user's which function
  tory@biotree.bio  ·  analytics-dashboard    31,800
  tory@biotree.bio  ·  pulse-map               9,400
  machine           ·  nightly-export         12,940
WHO and WHAT are two independent axes — read them separately. The first list answers "whose usage is expensive" (a single power user can be most of your bill); the second crosses it with the operation, so you see "Tory's analytics view costs 31,800 reads/day" — the exact pair you'd act on. They're never merged into one number, because the answer to "cut the cost" is different for each.
Reads with no person behind them don't vanish — background work keeps its tenant and shows as machine (a scheduled job, per-event processing), and a request with no identity yet clusters under anonymous. So an unattended app reading all night is still attributable: no who, but you can still see it's machine-driven and which function it is. The WHO section only appears once you've set an actor — a pure-OSS install with no identity wired stays clean.
The operation is the unit, not the page. One page load can fire six reads and only one is the monster, so the cross-match binds cost to the operation that spent it, resolved in order: an explicit bucket() name, then the SDK operation, then the route, then the collection. Name the heavy operation with bucket() and it leads both axes by its real name instead of a route you'd have to go translate.
Serverless: flush before you return
Buckets counts reads in memory and ships them on a timer (about once a minute). That's right for a long-lived server — but serverless runtimes (Cloud Functions, Lambda, Vercel, Cloud Run) freeze the container the instant your handler returns. A frozen container runs no timers and fires no beforeExit, so a short invocation's buffered counts are paused with it and never shipped: the reads were billed, but Buckets never saw the window. It under-reports, and it is worst under sparse traffic. The fix is one line — wrap your handler with withBuckets so its counts ship before the freeze. It costs nothing: it uses the split-second of CPU you have already paid for on that invocation; no container is kept awake.
import { bucket, withBuckets } from "@cross-deck/buckets";

// wrap any handler: its counts flush before the freeze, on success or throw
export const handler = withBuckets(async (event) => {
  await bucket("my-job", () => doWork(event));
});
Rule of thumb: if the runtime freezes or exits between invocations, call flush() in a finally at the edge of every handler — scheduled jobs, queue consumers, HTTP and callable functions alike. Wrap it once so you can't forget it: the published withBuckets wrapper, which flushes the meter — not any one datastore — so a single wrap covers every adapter you have installed at once (Firestore, MongoDB, Postgres). It costs nothing (it uses CPU already billed for the invocation; no container is kept awake), and if you skip it on serverless your numbers under-report on quiet traffic. On an always-on process (a container or classic Node server that stays up), the timer handles it and you don't need to.
Slack alerts: paged before the bill
This is the part that turns Buckets from a dashboard you remember to open into a system that finds you. Connect Slack (Developers → Integrations → Slack) and Crossdeck watches your buckets and pings you the moment a real read spike starts:
🟡 Read spike detected — 512,000 reads in the last hour, about 10× your normal for this time of day (~50,000). Open Buckets to see which bucket moved.
An ongoing spike pings once, not every hour. Shipped a feature you know adds reads? One click — "Expected — quiet for 24h" — and it hushes while the baseline re-learns. Your knowledge of your own roadmap is the final authority; the system never pretends to know better.
No Slack connected? Alerts still appear in the Buckets dashboard's Read-spike alerts card — connecting Slack just adds the ping.
How the baseline learns you
An alert is only trustworthy if it never cries wolf, so the detector is deliberately conservative:
- It learns first. For ~7 days it builds a baseline and fires nothing. The dashboard shows the progress — "baseline forming · day 3 of 7" — then "baseline armed."
- It knows the time of day. A separate baseline per hour-of-day, so a busy 2pm is judged against other 2pms — never against 3am. This is what stops the evening from looking like an anomaly every night.
- It follows your fixes. The baseline is recency-weighted: arrive bleeding 2M reads, fix down to 50k, and it forgets the 2M and settles at your new normal — so a later 50k→500k spike is a real deviation, not lost under an old number.
- Two gates. A spike must be both a large statistical jump and a meaningful multiple of normal, so a tiny bucket jittering by a few reads can never page you.
It never costs you reads
The one rule that holds the whole system together: the thing that watches your read bill must never run one up. The meter counts in memory and writes a small summary about once a minute. The baseline and the alert detector read that maintained summary — never your data. Nothing in Buckets, anywhere, scans. A cost tool that costs is a contradiction; this one can't.
What the collector sees — and what Crossdeck adds
The collector is open source and yours to run free. It's honest about its own edges — and each one is exactly what Crossdeck is for:
- It sees the surface you install it on. On your server it catches server reads — often the minority; most apps also read straight from the browser (a separate install). Your bill is the sum of both. Crossdeck stitches server + browser + every surface into one number, so you're never reasoning from a slice.
- One collector tells you the path; Crossdeck tells you the place. Standalone, a collector names which code a read came from on the one surface it runs on. Register and install the SDK — also free — and every surface stamps itself, all of it stitches into one view, and each bucket shows which environment(s) it bleeds from (server vs browser vs dashboard, colour-coded). That per-environment picture is additional functionality, still no cost — server and all web/JS surfaces today, native apps next.
- It can name the user too — but you wire it; the SDK wires it for you. Standalone, the cross-match needs one
setActorcall at your auth boundary. Register and install the SDK and that call happens onidentify()across every surface, so the same identity that drives revenue and analytics also splits read-cost by user — the same person, one identity, every layer. That cross — who × what they did × what it cost — is the thing no standalone read tool can do. - Reading the numbers back yourself costs a few reads — querying your own stored rollups is still a read. Inside Crossdeck you read a small maintained summary, so looking is free and live — the cost tool never costs you to check.
- The collector is the raw meter; Crossdeck is where it becomes action — the drill-down (tag → next-biggest → tag again), the before/after verdict, the 7-day baseline, and the Slack alerts above.
The numbers are identical on both sides — same counts, same source. Crossdeck just makes them whole, free to read, and impossible to miss. Onboard once, install the SDK, and read-cost comes with it — no second setup.
Related
- Track custom events — the same name-what-matters pattern, for analytics.
- Capture an error — the other half of "page me before it's a problem."
- Limits and quotas — the platform limits Buckets helps you stay inside.
Using an AI assistant? Read this page as clean markdown — index.md — or the whole docs index at /docs/llms.txt.